Secular Trends in Obesity and Caloric Intake: 1971-2008 Analysis
March 17, 2026 | by Robert Elliott

Executive Summary
The analysis of **secular trends in obesity** in the United States from 1971 to 2008 reveals a profound divergence in the relationship between reported energy intake, physical activity, and body mass index (BMI). Despite traditional public health emphasis on caloric balance, a significant ‘BMI gap’ emerged, indicating that for a consistent level of reported caloric and macronutrient intake, the predicted BMI was up to 2.3 kg/m² higher in 2006 than in 1988. This suggests that the rise in obesity cannot be solely attributed to increased consumption or decreased activity, but rather to fundamental shifts in energy disposition. The study, primarily based on NHANES data, challenges conventional wisdom regarding **secular trends in obesity** and necessitates a re-evaluation of the underlying metabolic context of the American population.
Key Statistics at a Glance
| Metric | Baseline Value (Year) | Peak Value (Year) | Latest Value (Year) | Change (absolute + %) |
|---|---|---|---|---|
| Average BMI (Men) | 25.9 kg/m² (1971–1975) | 28.6 kg/m² (2005–2008) | 28.6 kg/m² (2005–2008) | +2.7 kg/m² (+10.4%) |
| Average BMI (Women) | 26.3 kg/m² (1971–1975) | 29.5 kg/m² (2005–2008) | 29.5 kg/m² (2005–2008) | +3.2 kg/m² (+12.2%) |
| Caloric Intake (Men) | 2329 kcal (1971–1975) | ~2580 kcal (2008 est.) | ~2580 kcal (2008 est.) | +10–14% (overall) |
| Caloric Intake (Women) | 1688 kcal (1971–1975) | 1930 kcal (2005–2008) | 1930 kcal (2005–2008) | +242 kcal (+14.3%) |
| Leisure-Time Physical Activity (Men) | Baseline (1988) | Peak (2006) | Peak (2006) | +47% |
| Leisure-Time Physical Activity (Women) | Baseline (1988) | Peak (2006) | Peak (2006) | +120% |
| Carbohydrate Intake (Males, % of daily calories) | 42.1% (Baseline) | 47.7% (Peak) | 47.7% (Peak) | +5.6 percentage points (+13.3%) |
| Predicted BMI Gap (2006 vs. 1988) | 0 kg/m² (1988) | 2.3 kg/m² (2006) | 2.3 kg/m² (2006) | +2.3 kg/m² |
Historical Context and Background
The period between 1971 and 2008 represents a transformative era in American public health, marked by an unprecedented rise in the prevalence of obesity. Historically, public health discourse and interventions have largely operated under the paradigm of a simple energy balance model: ‘calories in versus calories out.’ This framework posits that weight gain is primarily a direct consequence of consuming more calories than are expended through physical activity. Consequently, strategic public health initiatives frequently emphasized increasing leisure-time physical activity and promoting total caloric restriction as primary means to combat rising obesity rates. U.S. Carbohydrate Intake Trends: 50 Years of Dietary Shifts The Ultimate Guide to Keto: Foods, Carb Limits, and Staying in Ketosis The Ultimate Beginner-Friendly Ketogenic Diet Guide
However, longitudinal surveillance data, particularly from the National Health and Nutrition Examination Survey (NHANES) and the Framingham Offspring Cohort, has begun to challenge the sufficiency of this traditional model. The initial baseline for this analysis, the early 1970s, predates the widespread public awareness and policy focus on the burgeoning obesity epidemic. At this time, dietary guidelines were beginning to shift, with an increasing emphasis on reducing fat intake, a recommendation that would profoundly influence food manufacturing and consumer choices for decades. The first Dietary Goals for the United States, published in 1977 by the Senate Select Committee on Nutrition and Human Needs, advocated for reducing fat and cholesterol, and increasing carbohydrate intake, setting the stage for a ‘low-fat’ dietary trend that would accelerate in subsequent decades. This policy environment, combined with evolving food technologies and marketing, created a complex landscape where the American diet was undergoing significant structural changes. Understanding these **secular trends in obesity** requires acknowledging this historical context, where public health messaging, dietary recommendations, and the food environment were all in flux, potentially contributing to the observed metabolic shifts. The report by Brown et al. (2015) critically examines this period, demonstrating that the relationship between reported lifestyle factors and physiological outcomes has diverged, suggesting a fundamental secular shift in the metabolic context of the American population.
Decade-by-Decade Analysis
The foundational period for understanding **secular trends in obesity** begins with the 1971–1975 National Health and Nutrition Examination Survey (NHANES I). This era provides the crucial baseline against which subsequent changes in American health metrics are measured. During NHANES I, the average Body Mass Index (BMI) for men was recorded at 25.9 kg/m², while for women, it stood slightly higher at 26.3 kg/m². These figures, while not indicative of widespread obesity by today’s standards, serve as a critical reference point for the dramatic increases that would follow. Caloric intake during this initial period was at its study-period minimum, with men consuming approximately 2329 kcal per day and women consuming about 1688 kcal per day, as reported by Brown et al. (2015).
This baseline is particularly important because it captures the American diet before the full impact of the ‘low-fat’ dietary recommendations began to permeate the food supply and public consciousness. While the first Dietary Goals for the United States were published in 1977, advocating for reduced fat intake, the early 1970s largely reflect dietary patterns that predated this widespread policy influence. The data from this period helps establish the initial physiological state of the population, providing a clear starting line for tracking the **secular trends in obesity** and associated dietary shifts over the subsequent nearly four decades. The relatively lower caloric intake and BMI figures from this era highlight the significant transformation that the American metabolic profile would undergo.
The period spanning the 1980s through 1994, encompassing NHANES II and NHANES III, marked a pivotal acceleration in the **secular trends in obesity** within the United States. During this era, Body Mass Index (BMI) began to exhibit significant increases across the population. Importantly, these BMI increases were observed despite relatively stable protein levels in the diet, suggesting that other macronutrient shifts were at play. A critical finding from this period, as highlighted by Brown et al. (2015), was the strengthening of an inverse relationship between relative caloric intake (kcal/kg) and BMI. This growing inverse correlation provided mathematical evidence for the emerging ‘BMI Gap’ paradox, indicating that for a given reported caloric intake per kilogram of body weight, individuals were becoming heavier than in previous decades.
This era also saw the initiation of the Framingham Offspring Cohort’s dietary tracking in 1991, as detailed by Vadiveloo et al. (2014). This longitudinal study began to provide high-resolution data on dietary evolution, complementing the cross-sectional snapshots from NHANES. The combined insights from these datasets revealed a complex interplay of factors contributing to the rising BMI. The increasing prevalence of processed foods, often reformulated to be ‘low-fat’ but higher in carbohydrates and sugars, likely played a role in these dietary shifts. The persistent rise in BMI during this period, even with stable protein intake and a paradoxical relationship between reported calories and weight, underscored that the traditional energy balance model was becoming increasingly insufficient to explain the observed **secular trends in obesity**.
The late 1990s through the early 2000s represented a critical juncture in the **secular trends in obesity**, often characterized as the zenith of the low-fat/high-carbohydrate dietary trend in the United States. During this period, public health messaging and food industry practices heavily favored reducing dietary fat. While overall trans-fat intake saw a decrease, moving from 1.6% to 1.2% of total energy, surveillance data confirms a nuanced shift in specific fat sources. The consumption of certain high-fat foods, such as cheese, eggs, ice cream desserts, butter, and sausages/processed meats, actually increased. Conversely, the intake of milk, margarine, and poultry decreased, as detailed in the CTC Macronutrient Trend Tracker and supported by Vadiveloo et al. (2014).
Despite these complex dietary shifts, the most striking observation during this era was the continued, and even accelerated, rise in Body Mass Index (BMI). This period further solidified the perplexing ‘BMI Gap,’ where individuals were exhibiting higher BMIs for comparable reported caloric and macronutrient intakes compared to earlier decades. The prevailing dietary advice, which encouraged carbohydrate consumption as a healthier alternative to fat, may have inadvertently contributed to an increase in overall energy density or altered metabolic responses. The sustained increase in BMI during this time, even as specific fat types were being reduced, underscored the inadequacy of simplistic dietary recommendations and highlighted the complex, multifactorial nature of the **secular trends in obesity**.
The most recent period analyzed, 2005–2008, offers crucial insights into the evolving **secular trends in obesity** and dietary patterns. During this timeframe, a notable stabilization in caloric intake was observed among females, remaining near 1930 kcal per day. However, despite this plateau in reported energy consumption, Body Mass Index (BMI) continued its upward trajectory across all demographic subgroups. By the end of this period, average BMI reached 29.5 kg/m² for women and 28.6 kg/m² for men, as reported by Brown et al. (2015) and Vadiveloo et al. (2014).
This continued rise in BMI, even in the absence of a corresponding increase in reported caloric intake, further deepens the paradox of the ‘BMI Gap.’ It strongly suggests that factors beyond simply ‘calories in’ are driving the **secular trends in obesity**. The data from this era reinforces the notion that the American population’s metabolic response to diet and lifestyle has fundamentally shifted. This divergence indicates that a contemporary individual would likely possess a higher BMI than a person of the same age and sex in 1988, even with identical reported intake and exercise. The stabilization of caloric intake in women, juxtaposed with persistent BMI increases, underscores the need to explore non-traditional etiological factors, such as environmental exposures, medication use, and changes in the gut microbiome, as contributors to the ongoing obesity epidemic.
Demographic and Subgroup Analysis
The analysis of **secular trends in obesity** reveals nuanced demographic differences in how these shifts manifested across the U.S. population between 1971 and 2008. While the overall trend showed a significant increase in both average BMI and total caloric intake, specific subgroups experienced these changes with varying magnitudes. For instance, the increase in average BMI was observed across both sexes, but women exhibited a slightly larger absolute increase, with their average BMI rising from 26.3 kg/m² in 1971–1975 to 29.5 kg/m² in 2005–2008, a change of 3.2 kg/m². Men, in comparison, saw their average BMI increase from 25.9 kg/m² to 28.6 kg/m² over the same period, a rise of 2.7 kg/m² (Brown et al., 2015).
Macronutrient shifts also displayed sex-specific patterns. While the population as a whole experienced a 5–9% decrease in fat and protein intake as a percentage of total energy, men specifically showed a 13% increase in carbohydrate intake, moving from 42.1% to 47.7% of daily calories. Further detailed tracking within the Framingham Offspring Cohort by Vadiveloo et al. (2014) highlighted that total fat intake increased from 27.3% to 29.8%. Notably, women in this cohort exhibited a greater increase in saturated fat intake and a smaller reduction in trans-fat consumption compared to men. This suggests that while overall dietary trends were broad, the specific manifestations of these **secular trends in obesity** and dietary composition had distinct gendered dimensions.
Regarding physical activity, a significant paradox emerged across both sexes. Despite the surge in obesity, reported leisure-time physical activity frequency increased substantially between 1988 and 2006: by 47% in men and a remarkable 120% in women (Brown et al., 2015). This demographic finding directly challenges the simplistic narrative that reduced activity is the primary driver of the obesity epidemic. The consistent rise in BMI across all subgroups, even as caloric intake stabilized in females by 2005–2008, indicates that the complex interplay of environmental, biological, and societal factors is influencing **secular trends in obesity** beyond simple demographic categorizations of diet and exercise.
Methodology and Data Sources
The comprehensive analysis of **secular trends in obesity** and dietary patterns in the United States from 1971 to 2008 relied on two distinct yet complementary methodological frameworks: the National Health and Nutrition Examination Survey (NHANES) and the Framingham Offspring Cohort. Each approach provided unique insights into the evolving American metabolic landscape.
The NHANES analysis, as detailed by Brown et al. (2015), utilized a cross-sectional design, examining data from 36,377 adults across multiple survey cycles. This framework employed 24-hour dietary recalls to capture food and beverage consumption, coupled with detailed physical examinations to measure anthropometric data such as Body Mass Index (BMI). To ensure robust statistical analysis, generalized linear models were applied, adjusting for potential confounding variables including age, ethnicity, smoking status, and educational attainment. A crucial aspect of the NHANES methodology was the use of Harris-Benedict equations to predict individual energy needs. By comparing these predicted needs against self-reported caloric intake, researchers were able to quantify the magnitude of reporting bias, particularly the systematic under-reporting prevalent in dietary surveys. This allowed for a more accurate interpretation of reported caloric intake in the context of observed weight changes. The NHANES data, accessible via the National Nutrition Survey Database, provides a representative snapshot of the U.S. civilian non-institutionalized population at various points in time, making it invaluable for identifying broad **secular trends in obesity**.
In parallel, the Framingham Offspring Cohort, as described by Vadiveloo et al. (2014), contributed a crucial longitudinal perspective. This study followed 2,732 adults over an extended period of 17 years, specifically from 1991 to 2008. Dietary data in this cohort was collected using semi-quantitative Food Frequency Questionnaires (FFQ), administered across four distinct examinations. The longitudinal nature of this study allowed researchers to track the dietary evolution of individuals as they aged, providing high-resolution data on shifts in food groups and macronutrient composition within the same individuals over time. A repeated-measures model was employed to analyze these changes, offering a dynamic view of dietary habits that cross-sectional data alone cannot provide. This approach was particularly effective in identifying subtle changes in fat intake and specific food consumption patterns that contribute to the **secular trends in obesity**.
Together, these methodologies, despite their inherent differences in design and data collection, provided a robust evidence base for understanding the complex interplay between diet, physical activity, and body weight over nearly four decades. The combination of broad population-level surveillance (NHANES) with detailed individual-level tracking (Framingham) allowed for a comprehensive assessment of the factors contributing to the observed **secular trends in obesity**.
Limitations and Caveats
[IMAGE_3_PLACEHOLDER]
While the methodologies employed to analyze **secular trends in obesity** from 1971 to 2008 are robust, it is imperative for nutritional epidemiologists and health journalists to acknowledge their inherent limitations to avoid misinterpretation of the data. One of the most pervasive and significant constraints is self-reporting bias. Dietary recall methods, whether 24-hour recalls used in NHANES or Food Frequency Questionnaires (FFQs) in the Framingham Offspring Cohort, are susceptible to systematic under-reporting of energy intake. This bias is particularly pronounced in certain demographic groups; Brown et al. (2015) found that females and individuals with higher Body Mass Index (BMI) tend to under-report more significantly. Comparisons with Harris-Benedict predictions, which estimate energy needs, suggested that females, assuming a moderately active lifestyle, under-reported their intake by a substantial 16–24%. This systematic bias means that reported caloric intake figures may not fully reflect actual consumption, potentially masking larger increases in energy intake than observed.
Furthermore, the cross-sectional nature of the NHANES data, while excellent for identifying population-level associations and **secular trends in obesity**, inherently limits the ability to infer causality. While strong correlations can be observed between dietary shifts and BMI changes, cross-sectional studies cannot definitively prove that one factor directly causes another. This distinction is crucial for policy formulation, as associations do not always translate into direct cause-and-effect relationships.
The Food Frequency Questionnaires (FFQs) used in the Framingham Offspring Cohort also present specific constraints. As noted by Vadiveloo et al. (2014), FFQs are often limited in their ability to capture precise portion sizes, which can lead to inaccuracies in estimating absolute nutrient intake. Moreover, FFQs may struggle to differentiate between low-fat and high-fat versions of the same food product, such as different types of yogurt or milk. This lack of granularity can attenuate observed dietary differences, potentially underestimating the true impact of specific food choices on **secular trends in obesity**. These methodological nuances necessitate careful consideration when drawing evidence-based clinical conclusions or formulating public health policies, ensuring that the limitations of the data are fully understood and accounted for.
Policy Implications and Expert Commentary
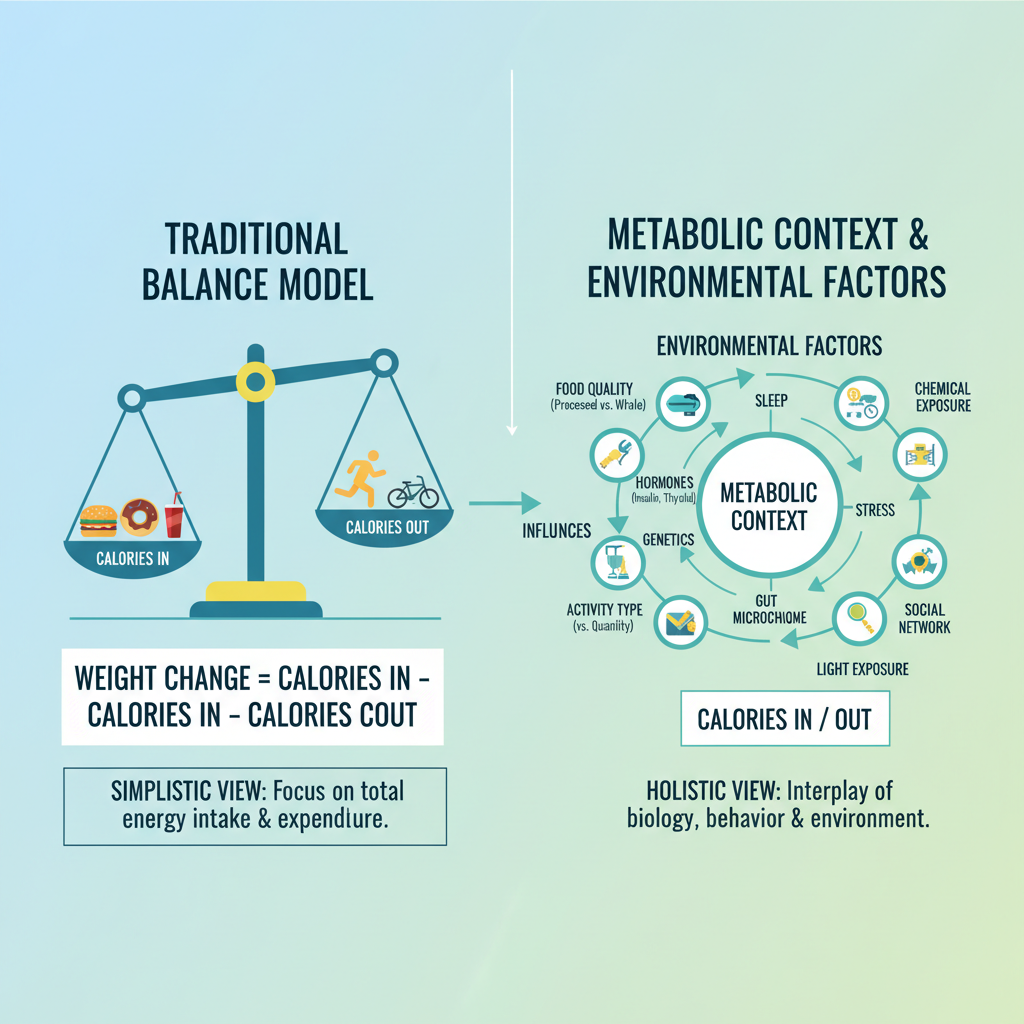
The observed **secular trends in obesity** and the divergence between reported energy balance and physiological outcomes carry profound implications for public health policy and the formulation of dietary guidelines. Traditional policy frameworks, often rooted in the ‘calories in, calories out’ model, may require significant re-evaluation. The finding that a contemporary individual is consistently heavier than someone in the 1980s with identical reported diet and exercise levels, as highlighted by Brown et al. (2015), suggests that current public health interventions solely focused on caloric restriction and increased physical activity may be insufficient to reverse the obesity epidemic.
Official dietary guidelines, such as the Dietary Guidelines for Americans, periodically updated by the USDA and HHS, have historically emphasized macronutrient distribution and caloric limits. While these guidelines remain critical for promoting overall healthy eating patterns, the data on **secular trends in obesity** indicates that their impact on population-level weight management may be complicated by factors beyond individual compliance. For instance, the report notes that while Americans reduced the percentage of energy from fat, this was often an artifact of a surge in carbohydrate intake, meaning absolute fat intake in grams often remained stable or even increased (Vadiveloo et al., 2014). This suggests that policy recommendations focusing on percentage reductions of macronutrients might not always translate into desired health outcomes if the overall food environment encourages compensatory increases in other energy-dense components.
Furthermore, the significant increase in reported leisure-time physical activity—up to 120% in women—despite rising BMI, challenges the policy narrative that attributes obesity primarily to a decline in activity. This finding, from Brown et al. (2015), necessitates a broader policy approach that considers a wider array of etiological factors. Future public health strategies must move beyond simplistic explanations and incorporate emerging evidence regarding environmental toxins, medications associated with weight gain, maternal age, low calcium intake, reduced variability in ambient temperature, inadequate sleep, and the gut microbiome as potential modulators of energy disposition. Policymakers should consider a multi-faceted approach that addresses these complex determinants of **secular trends in obesity**, potentially including regulations on food processing, urban planning to promote active living, and research funding into environmental health factors. The World Health Organization (WHO) also acknowledges the complex interplay of factors contributing to obesity, aligning with the need for comprehensive policy responses.
Journalist Summary
New research tracking **secular trends in obesity** in the United States from 1971 to 2008 reveals a significant divergence between reported diet and exercise and actual weight gain. Analysis of NHANES data shows that for a consistent level of reported caloric and macronutrient intake, the predicted Body Mass Index (BMI) was up to 2.3 kg/m² higher in 2006 than in 1988. This ‘BMI gap’ suggests that factors beyond simple ‘calories in, calories out’ are driving the obesity epidemic. Notably, leisure-time physical activity increased by as much as 120% in women during this period, even as obesity rates climbed. These findings challenge traditional public health models and call for a re-evaluation of the underlying metabolic context of the American population.
Quick Reference
Between 1971 and 2008, average BMI and total caloric intake increased by 10–14% across the U.S. population (Brown et al., 2015). For a consistent level of reported caloric intake, predicted BMI was up to 2.3 kg/m² higher in 2006 than in 1988 (Brown et al., 2015). Reported leisure-time physical activity frequency increased by 47% in men and 120% in women between 1988 and 2006 (Brown et al., 2015). Carbohydrate intake for males increased by 13% from 42.1% to 47.7% of daily calories (Brown et al., 2015). Total fat intake increased from 27.3% to 29.8% in the Framingham Offspring Cohort (Vadiveloo et al., 2014). By 2005–2008, caloric intake stabilized in females near 1930 kcal, yet BMI continued to rise, reaching 29.5 kg/m² for women and 28.6 kg/m² for men (Brown et al., 2015; Vadiveloo et al., 2014). Females under-reported energy intake by 16–24% when compared to Harris-Benedict predictions (Brown et al., 2015).
Sources and References
- Brown, R. E., et al. (2015). “Secular differences in the association between caloric intake, macronutrient intake, and physical activity with obesity.” Obesity Research & Clinical Practice.
- Vadiveloo, M., et al. (2014). “Trends in dietary fat and high-fat food intakes from 1991 to 2008 in the Framingham Heart Study participants.” British Journal of Nutrition.
- U.S. Department of Agriculture and U.S. Department of Health and Human Services. Dietary Guidelines for Americans.
- World Health Organization. Obesity and overweight fact sheet.
RELATED POSTS
View all