US Added Sugar Intake Trends: 1970-2023 Surveillance Analysis
March 17, 2026 | by Robert Elliott

Executive Summary
The analysis of **added sugar intake trends** in the United States from 1970 to 2023 reveals a dramatic rise culminating in a peak in 1999, followed by a modest decline. National surveillance, primarily utilizing data from the National Health and Nutrition Examination Survey (NHANES), indicates that caloric sweetener availability reached a historical high of 69 kg (153 pounds) per person per year in 1999. This period saw significant shifts in the food supply, notably the increased prevalence of high-fructose corn syrup and processed foods. While a 14% reduction in **added sugar intake trends** was observed between 1999 and 2014, these changes were not uniform across all demographics, with younger adults showing the most significant decrease.
Key Statistics at a Glance
| Metric | Baseline Value (Year) | Peak Value (Year) | Latest Value (Year) | Change (absolute + %) |
|---|---|---|---|---|
| Caloric Sweetener Availability | <1% (1970s) for HFCS | 69 kg (1999) | 14% reduction from 1999 (2014) | +42% of market share for HFCS by 2000; -14% overall from peak |
| HFCS Market Share | <1% (1970s) | 42% (2000) | Not specified beyond 2000 | +41% market share (1970s-2000) |
| Added Sugar Intake (kcal/day) | 235 kcal (1977) | 318 kcal (late 1990s) | Not specified | +83 kcal (1977-late 1990s) |
| Women’s Mean Energy Intake | 1,542 kcals (1971) | 1,877 kcals (2000) | Not specified | +335 kcals (+21.7%) |
| Obesity Prevalence | 14.5% (1971) | 30.9% (2000) | Not specified | +16.4% (+113.1%) |
Historical Context and Background
The strategic monitoring of added sugar intake is a cornerstone of modern public health surveillance, providing crucial insights into the nutritional evolution of the American populace. Understanding why this metric matters requires an examination of its profound impact on public health and the economic burden of diet-related diseases. Historically, the United States has grappled with an increasing prevalence of noncommunicable diseases (NCDs) such as obesity, type 2 diabetes, and cardiovascular disorders. The consumption of caloric sweeteners, particularly added sugars, has been identified as a significant dietary factor contributing to these health challenges. U.S. Carbohydrate Intake Trends: 50 Years of Dietary Shifts Net Carbs in Fruits: The Ultimate Scientific Guide for Health-Conscious Eaters Secular Trends in Obesity and Caloric Intake: 1971-2008 Analysis
The period between 1970 and 2023 represents an era of significant dietary volatility, during which the American food supply underwent profound structural changes. This shift moved away from nutrient-dense whole foods towards calorie-dense processed matrices that utilized a complex array of refined carbohydrates and alternative sweeteners. This transformation was not accidental but rather a confluence of industrial innovation, evolving dietary philosophies, and economic pressures. Early public health efforts, particularly in the 1970s and 1980s, often focused on reducing dietary fat intake due to concerns about coronary heart disease, inadvertently paving the way for increased sugar consumption as manufacturers sought to maintain palatability in low-fat products.
National surveillance, primarily through robust datasets like the National Health and Nutrition Examination Survey (NHANES), has been instrumental in tracking these shifts. NHANES, with its detailed 24-hour dietary recalls, captures consumption patterns across diverse demographics, offering an empirical foundation for developing dietary guidelines and evaluating the efficacy of health interventions. The data collected through these surveys are vital for understanding the long-term trajectory of added sugar intake trends and their correlation with public health outcomes. Without such surveillance, policymakers and health professionals would lack the evidence base needed to formulate effective strategies to mitigate the health risks associated with excessive sugar consumption.
The economic implications of unchecked added sugar intake trends are substantial, contributing to healthcare costs associated with treating chronic diseases. Therefore, comprehensive analysis of these trends is not merely an academic exercise but a critical component of national health policy, aimed at improving population health and reducing the societal burden of preventable illnesses. The historical baseline of the 1970s, before the widespread adoption of high-fructose corn syrup and the ‘low-fat’ dietary paradigm, serves as a crucial reference point against which subsequent changes in added sugar intake can be measured and evaluated.
Decade-by-Decade Analysis
The 1970s marked a pivotal period in the American diet, characterized by the commercial introduction and rapid integration of High-Fructose Corn Syrup (HFCS) into the food supply. While HFCS represented less than 1% of the caloric sweeteners used in the U.S. during this decade, its nascent presence set the stage for a dramatic transformation in how Americans consumed sugar. This era saw an initial, yet significant, increase in estimated total sugar intake, rising from 235 kcal per day in 1977 to 318 kcal by the late 1990s, as documented in the Nutrients 2023 report. This early upward trajectory in added sugar intake trends was influenced by a confluence of factors, including technological advancements in food processing and the burgeoning availability of new sweetener options.
During this time, public health discourse was beginning to shift, but the full implications of increased sugar consumption were not yet widely understood. The focus remained largely on other dietary components, which would later influence the food industry’s formulation strategies. The 1970s laid the groundwork for the subsequent decades of elevated added sugar intake trends, as HFCS offered a cost-effective and versatile sweetener solution for food manufacturers. The data from NHANES I (1971–1974) and NHANES II (1976–1980), utilizing 24-hour dietary recalls, began to capture these initial shifts in the civilian, noninstitutionalized population across the contiguous 48 states and later all 50 states. These early surveillance efforts, though limited in their scope compared to later iterations, provided the first glimpses into the evolving patterns of American dietary habits and the emerging role of novel sweeteners in the food landscape.
The relatively low HFCS market share in the 1970s belied its future dominance, which would profoundly impact subsequent added sugar intake trends. This decade was a quiet precursor to the sugar surge, with the foundations being laid for a food system increasingly reliant on inexpensive and abundant caloric sweeteners. The rise in daily caloric intake from sugar, even in these early years, signaled a fundamental change in the dietary composition of the average American, setting the stage for the health challenges that would become more apparent in later decades.
The 1980s and 1990s witnessed the peak influence of the ‘low-fat wave’ on American dietary policy and food manufacturing. Driven by the ‘saturated fat and cholesterol theory,’ public health campaigns heavily prioritized the reduction of dietary fats to combat coronary heart disease (CHD). This philosophy led to a proliferation of ‘low-fat’ and ‘fat-free’ food alternatives across grocery store aisles. However, to compensate for the loss of flavor and texture when fat was removed, manufacturers frequently increased the use of refined sugars, including HFCS, to maintain palatability. This industrial pivot significantly contributed to the escalating added sugar intake trends during this period.
Consequently, mean energy intake rose sharply. Surveillance data from the CDC’s 2004 report, ‘Trends in Intake of Energy and Macronutrients — United States, 1971–2000,’ revealed a critical nuance: while the *percentage* of calories from fat decreased, women’s absolute fat intake actually increased by 6.5g per day between 1971 and 2000. More dramatically, carbohydrate intake surged by 62.4g, as total energy intake for women jumped from 1,542 to 1,877 kcals per day over the same period. This increase in carbohydrate consumption, largely driven by added sugars, directly fueled the upward trajectory of added sugar intake trends.
By the year 2000, HFCS, which had accounted for less than 1% of caloric sweeteners in the 1970s, escalated dramatically to constitute 42% of the market, as reported in Nutrients 2023. This industrial dominance of HFCS reflected its economic advantages and functional properties in processed foods and beverages. The NHANES III (1988–1994) and NHANES 1999–2000 cycles, with their revised 24-hour dietary recall formats and inclusion of weekend data, captured the full extent of these shifts. These methodological enhancements provided a more comprehensive picture of the burgeoning added sugar intake trends, revealing a population increasingly consuming energy-dense, nutrient-poor foods that were high in refined carbohydrates and caloric sweeteners, setting the stage for the consumption peak at the turn of the millennium.
The turn of the millennium marked the zenith of added sugar consumption in the United States, with 1999 representing the historical peak of caloric sweetener availability. According to food availability data cited in Nutrients 2023, added sugars and sweeteners reached an unprecedented 69 kg (153 pounds) per person per year. This figure underscores the pervasive integration of sweeteners into the American diet by this point, reflecting decades of industrial shifts and dietary trends.
During the early 2000s, the ‘added sugar hypothesis’ returned to prominence as public health concerns mounted regarding the rising rates of obesity and related chronic diseases. Surveillance data from NHANES during this period unequivocally identified sugar-sweetened beverages (SSBs) as the primary vehicle for this elevated intake. Specifically, in the early 2000s, SSBs accounted for nearly half (49.7%) of the daily added sugar intake among younger adults, highlighting their significant contribution to overall caloric sweetener consumption, as detailed in Nutrients 2023. This statistic is critical for understanding the patterns of added sugar intake trends and the specific dietary sources driving them.
The dramatic increase in total daily energy intake observed between 1971 and 2000, where women’s mean intake rose from 1,542 to 1,877 kcals per day (CDC 2004), directly correlates with the peak in added sugar availability. This period also coincided with a staggering surge in national obesity rates, which more than doubled from 14.5% in 1971 to 30.9% by 2000 (CDC 2004). While not solely attributable to sugar, the parallel rise in added sugar intake trends and obesity prevalence underscored the urgent need for public health interventions and a re-evaluation of dietary guidelines. The data from this era provided compelling evidence that the American diet had become excessively reliant on caloric sweeteners, with significant implications for population health.
The 2010s ushered in a period of modest, yet significant, decline in added sugar consumption, marking a shift from the peak levels observed at the turn of the century. Compared to the 1999 zenith, a 14% reduction in the consumption of added sugars and sweeteners was documented by the USDA between 1999 and 2014, as reported in Nutrients 2023. This decline, while positive, was not uniform across the entire population, indicating nuanced changes in added sugar intake trends.
NHANES data from 2001–2018 provided a more granular view, revealing that the reduction in added sugar intake was primarily observed in younger adults, specifically those aged 19–50. For this demographic, the mean daily intake dropped from 96.6g to 72.3g per day, a substantial decrease that suggests increased awareness or behavioral changes among younger generations. Despite this encouraging trend, sugar-sweetened beverages (SSBs) continued to be the dominant source of added sugars in Western diets, underscoring the persistent challenge they pose to public health efforts aimed at reducing added sugar intake trends.
The period from 2020 to 2023 highlights a complex and evolving landscape. While traditional sugar consumption remains high—often well above the recommended 5–10% of daily energy intake—there’s an increasing trend of supplementation with low-calorie alternatives. Low-calorie sweeteners, for instance, saw an annual growth rate of 5.1% between 2008 and 2015, as noted in Nutrients 2023. Current research continues to investigate the ‘generational delay’ theory, which posits that current adult obesity rates may reflect the high-sugar diets consumed by individuals who were children in the 1970s and 1980s. This theory suggests a long-term lag between dietary exposure and health outcomes, adding another layer of complexity to understanding the full impact of past added sugar intake trends on present-day health. The ongoing surveillance in this era seeks to capture these emerging patterns and their implications for future public health strategies.
Demographic and Subgroup Analysis
Understanding added sugar intake trends requires a detailed examination of how consumption patterns vary across different demographic groups. While the source report provides some insights into age-related shifts, it offers limited explicit data on breakdowns by sex, income level, or ethnicity. However, the available information allows for a focused discussion on age-specific trends and their implications.
A significant finding from NHANES data covering 2001–2018 indicates that the modest decline in added sugars observed since the turn of the millennium was not uniformly distributed across the U.S. population. Instead, this reduction was primarily concentrated among younger adults, specifically those aged 19–50. For this cohort, the mean daily added sugar intake decreased from 96.6g to 72.3g per day, as reported in Nutrients 2023. This suggests a potential shift in dietary habits or increased awareness among younger generations regarding the health implications of high sugar consumption. This demographic-specific reduction is a crucial aspect of understanding the overall trajectory of added sugar intake trends.
Conversely, the report does not explicitly detail similar declines or even stable patterns for older adult populations or children. This absence of data for other age groups implies that the overall national reduction in added sugar intake might be largely driven by the changes within the 19-50 age bracket, and other demographics might not have experienced the same magnitude of change, or their trends might even be stagnant or increasing. This highlights a potential area for further research and targeted interventions.
Furthermore, the consistent identification of sugar-sweetened beverages (SSBs) as the dominant source of added sugars, particularly among younger adults (accounting for 49.7% of daily sugar intake in the early 2000s), points to a specific dietary component that disproportionately affects certain age groups. While the report does not provide specific data on how SSB consumption varies by income or ethnicity, general public health literature often indicates disparities in SSB intake across socioeconomic lines, which could indirectly influence overall added sugar intake trends in these groups.
The ‘generational delay’ theory, mentioned in Nutrients 2023, also touches upon demographic implications. This theory suggests that current adult obesity rates may be a delayed consequence of high-sugar diets consumed during childhood in earlier decades, specifically the 1970s and 1980s. This implies that the added sugar intake trends of past generations could be manifesting as health outcomes in present-day older adults, underscoring the long-term impact of dietary patterns across the lifespan. While direct demographic breakdowns for all variables are not provided in the source, the available age-specific data offers valuable insights into the complex dynamics of added sugar intake trends in the U.S.
Methodology and Data Sources
The accuracy and reliability of assessing added sugar intake trends in the United States over several decades depend fundamentally on robust and standardized surveillance methodologies. The primary instrument for this long-term tracking has been the National Health and Nutrition Examination Survey (NHANES), conducted by the Centers for Disease Control and Prevention (CDC). NHANES is a continuous program designed to assess the health and nutritional status of adults and children in the United States, combining interviews and physical examinations.
Central to NHANES’s dietary assessment is the 24-hour dietary recall method. This involves trained interviewers asking participants to recall all foods and beverages consumed over the preceding 24-hour period. This method aims to capture detailed information on food types, quantities, and preparation methods. The data collected is then used to estimate nutrient intake, including added sugars, by linking reported foods to comprehensive food composition databases. The ‘MEC-based’ notation refers to data collected in Mobile Examination Centers, where the interviews often take place.
Over the surveillance period from 1970 to 2023, NHANES has undergone several iterations, each with specific survey periods and methodological nuances that are critical for understanding the comparability of data across cycles:
- **NHANES I (1971–1974):** This initial cycle utilized 24-hour dietary recall (MEC-based) and focused on the civilian, noninstitutionalized population residing in the contiguous 48 states.
- **NHANES II (1976–1980):** Expanding its scope, this cycle also employed 24-hour dietary recall (MEC-based) but included the civilian, noninstitutionalized population across all 50 states.
- **NHANES III (1988–1994):** A significant methodological change occurred in this cycle. While still using 24-hour dietary recall, the format was revised, and, crucially, weekend data was included for the first time. This change has implications for interpreting observed shifts in consumption, as weekend eating patterns often differ from weekdays. The population scope remained the civilian, noninstitutionalized population across all 50 states.
- **NHANES 1999–2000 and subsequent continuous NHANES cycles:** These cycles continued with 24-hour dietary recall (MEC-based) for the civilian, noninstitutionalized population in all 50 states, building upon the methodological refinements of NHANES III.
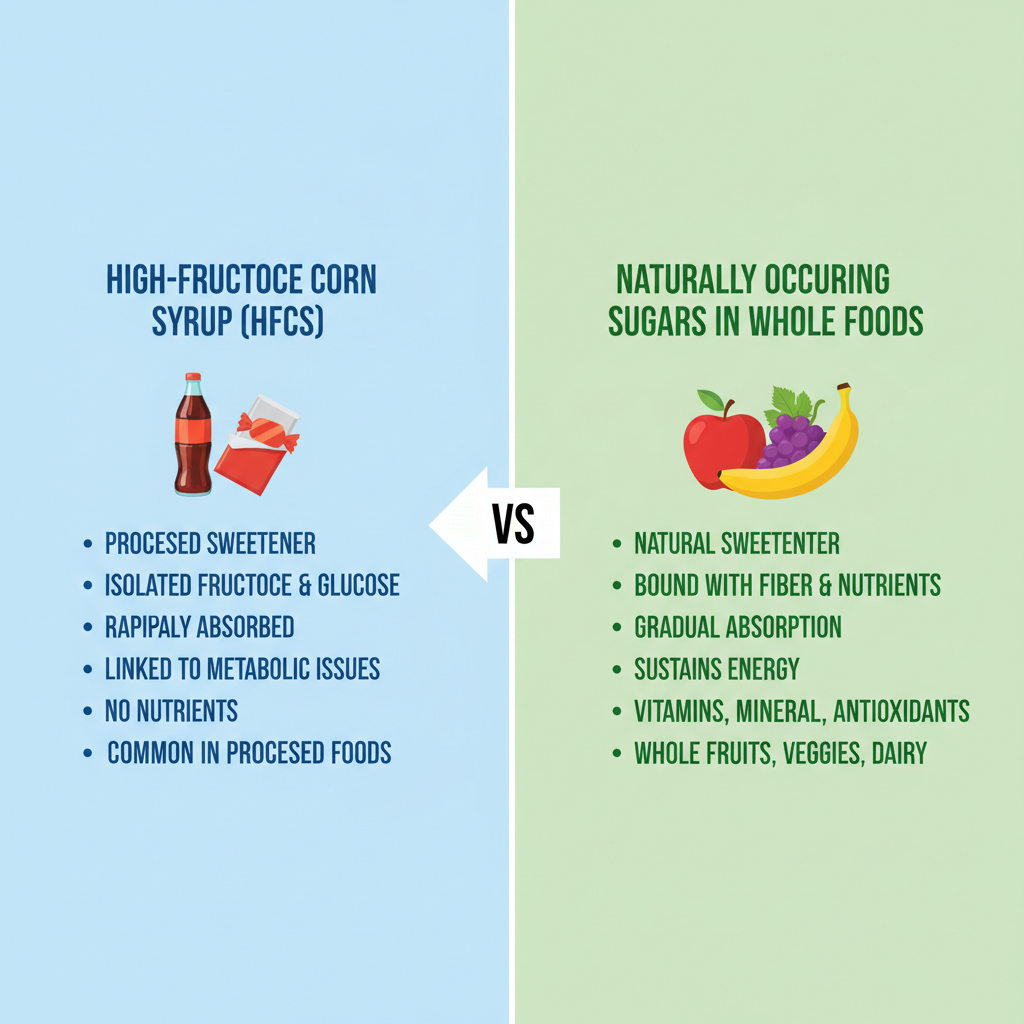
The calculation of added sugar intake trends relies on the precise definition of ‘added sugars.’ These are defined as sugars added during food preparation or manufacturing, encompassing substances like glucose, fructose, sucrose, and High-Fructose Corn Syrup (HFCS). This definition is distinct from ‘free sugars,’ a broader term used by the World Health Organization (WHO), which includes added sugars plus those naturally present in honey, fruit juices, and syrups, but excludes intrinsic starches in cereal grains and sugars found within the cellular structure of whole fruits, vegetables, and dairy (Nutrients 2023). This distinction is vital for accurate interpretation of added sugar intake trends.
Beyond NHANES, food availability data, such as that used to determine the 1999 peak of 69 kg (153 pounds) of caloric sweeteners per person, provides another layer of surveillance. This type of data estimates the amount of food available for consumption in a country, offering a macro-level perspective on the food supply, complementing the individual-level intake data from NHANES. The combined use of these datasets allows for a comprehensive assessment of added sugar intake trends over time.
Limitations and Caveats

While nutritional data are indispensable for public health surveillance, their interpretation must be approached with caution due to inherent limitations and potential measurement uncertainties. These constraints are particularly relevant when analyzing long-term added sugar intake trends.
One of the most significant limitations stems from **self-report and recall bias** inherent in 24-hour dietary recalls. Participants may inaccurately remember or deliberately underreport their food and beverage consumption. This issue is compounded by the tendency for underreporting energy intake to increase as Body Mass Index (BMI) increases, as noted in Nutrients 2023. This systematic bias can lead to an underestimation of actual added sugar intake, especially in populations with higher rates of overweight and obesity.
Furthermore, the validity of some NHANES dietary data has been questioned. Researchers such as Archer, E., et al. (2013) have characterized NHANES dietary data as ‘physiologically implausible and inadmissible as scientific evidence,’ suggesting that reported intakes often do not align with the biological energy requirements of the participants. This raises concerns about the absolute accuracy of reported caloric and macronutrient intakes, which directly impacts the precision of estimated added sugar intake trends.
**Methodological artifacts** also present challenges to consistent data interpretation. A notable example is the change introduced in NHANES III (1988–1994), which began including weekend data and revised its interview format. Since consumption patterns, including those of added sugars, are typically higher on weekends, this methodological shift could partially explain an observed ‘jump’ in consumption during NHANES III. The CDC (2004) suggests this might be a measurement artifact rather than purely a behavioral shift, making direct comparisons across early NHANES cycles more complex when assessing added sugar intake trends.
Another critical confounder is the **Energy Balance Model**, which posits that obesity is influenced by both total caloric intake and physical inactivity. With over 80% of adolescents insufficiently active, as highlighted in Nutrients 2023, it becomes challenging to isolate added sugar as the sole driver of weight gain or to attribute changes in obesity rates solely to shifts in added sugar intake trends. This multifactorial nature of obesity means that while added sugar is a significant risk factor, it operates within a broader context of lifestyle and dietary habits.
Finally, changes in food composition databases over time, while intended to improve accuracy, can also introduce slight inconsistencies when comparing data across decades. As scientific understanding of food components evolves and new food products emerge, the nutrient values assigned to foods may be updated, potentially affecting the precise calculation of added sugar intake trends over a 50-year period.
Policy Implications and Expert Commentary
The comprehensive analysis of added sugar intake trends in the United States carries significant implications for public health policy, informing the development and refinement of dietary guidelines and interventions. The observed trajectory of consumption, from a dramatic rise to a modest decline, underscores the dynamic nature of the American diet and the persistent challenges in promoting healthier eating patterns.
Current dietary guidelines consistently recommend limiting the intake of added sugars. For instance, the Dietary Guidelines for Americans advise that individuals limit calories from added sugars to less than 10% of total daily calories. The World Health Organization (WHO) goes further, recommending a reduction to less than 5% of total daily energy intake for additional health benefits. The fact that traditional sugar consumption in the U.S. remains
Journalist Summary
National surveillance data indicates that added sugar intake trends in the U.S. peaked in 1999, with caloric sweetener availability reaching 153 pounds per person annually, according to the Nutrients 2023 report. High-fructose corn syrup’s market share dramatically increased from less than 1% in the 1970s to 42% by 2000. While a 14% reduction in added sugars occurred between 1999 and 2014, this decline was primarily observed in younger adults. Experts caution against attributing obesity solely to sugar, noting that total caloric intake and physical inactivity are significant confounders, and methodological artifacts like changes in NHANES data collection can influence reported trends.
Quick Reference
U.S. dietary surveillance between 1970 and 2023 reveals a dramatic rise and subsequent modest decline in added sugar intake. Caloric sweetener availability peaked in 1999 at 69 kg (153 lbs) per person annually [Nutrients 2023, 3]. High-fructose corn syrup usage escalated from <1% in the 1970s to 42% by 2000 [Nutrients 2023, 3]. Between 1971 and 2000, mean daily energy intake for women rose from 1,542 to 1,877 kcals [CDC 2004, 1]. While the percentage of calories from fat decreased for women, absolute fat intake increased by 6.5g [CDC 2004, 1]. A 14% reduction in added sugars occurred between 1999 and 2014, primarily among younger adults [Nutrients 2023, 3]. Low-calorie sweeteners grew at 5.1% annually between 2008 and 2015 [Nutrients 2023, 4]. Obesity rates more than doubled from 14.5% in 1971 to 30.9% in 2000 [CDC 2004, 1]. Experts must account for recall bias and the 1988 inclusion of weekend data when interpreting these trends [Nutrients 2023, 4; CDC 2004, 2].
Sources and References
- Archer, E., et al. (2013). “The NHANES dietary data are physiologically implausible and inadmissible as scientific evidence.” PLoS ONE.
- CDC (2004). “Trends in Intake of Energy and Macronutrients — United States, 1971–2000.” Morbidity and Mortality Weekly Report, 53(04).
- Gillespie, K.M., et al. (2023). “The Impact of Free Sugar on Human Health—A Narrative Review.” Nutrients, 15, 889.
- Sugar Association, Inc. (2024). “How Well Do You Know Sugar?” Third Edition.
RELATED POSTS
View all


Keto Diet for Beginners: Your Complete 30-Day Starter Guide
October 21, 2025 | by Robert Elliott

Top High Net-Carb Foods to Avoid on Keto: Simple Swaps for Success
December 10, 2025 | by robbeaux