U.S. Carbohydrate Intake Trends: 50 Years of Dietary Shifts
March 16, 2026 | by Robert Elliott

Executive Summary
An in-depth analysis of U.S. carbohydrate intake trends from 1971 to 2023 reveals significant shifts in dietary patterns, with carbohydrates becoming the dominant energy source for Americans. Data from the National Health and Nutrition Examination Survey (NHANES) and What We Eat in America (WWEIA) show that between 1971 and 2004, over 80% of the increase in daily per capita energy availability was derived from carbohydrates. While there has been a notable reduction in added sugar intake among younger adults (19–50 years) by 25% between 2001 and 2018, the overall U.S. carbohydrate intake trends indicate that most demographic groups still exceed recommended guidelines for added sugars. This comprehensive report meticulously details these U.S. carbohydrate intake trends, offering critical insights for public health policy.
Key Statistics at a Glance
| Metric | Baseline Value (Year) | Peak Value (Year) | Latest Value (Year) | Change (absolute + %) |
|---|---|---|---|---|
| Men’s Daily Energy Intake | 9,832 kJ (1971) | 11,652 kJ (2004) | N/A | +1,820 kJ (+18.5%) |
| Women’s Daily Energy Intake | 6,418 kJ (1971) | 8,142 kJ (2004) | N/A | +1,724 kJ (+26.9%) |
| Men’s % Energy from Carbs | 42.7% (1971) | 48.0% (2004) | N/A | +5.3 pp (+12.4%) |
| Women’s % Energy from Carbs | 45.4% (1971) | 50.6% (2004) | N/A | +5.2 pp (+11.5%) |
| Younger Adults’ Added Sugar Intake (% kcal) | 16.2% (2001) | 16.2% (2001) | 12.7% (2018) | -3.5 pp (-21.6%) |
| Younger Adults’ Added Sugar Intake (g/d) | N/A | N/A | 25% reduction (2001-2018) | -25% (absolute) |
| Non-Hispanic Black Added Sugar Intake (% kcal) | N/A | 14.5% (2018) | 14.5% (2018) | N/A |
| Non-Hispanic Asian Added Sugar Intake (% kcal) | N/A | 8.1% (2018) | 8.1% (2018) | N/A |
Historical Context and Background
The trajectory of U.S. carbohydrate intake trends over the past five decades is inextricably linked to broader shifts in public health policy, food manufacturing, and consumer behavior. Understanding the historical context is crucial for interpreting the epidemiological data. The period commencing in the early 1970s marked a pivotal era in American nutrition. Prior to this, dietary advice was less formalized, but growing concerns about chronic diseases began to catalyze federal involvement. The first iteration of the Dietary Goals for the United States, published in 1977 by the Senate Select Committee on Nutrition and Human Needs (often called the ‘McGovern Report’), notably recommended reducing fat and cholesterol intake. This recommendation, while intended to improve cardiovascular health, inadvertently paved the way for increased U.S. carbohydrate intake trends, as food manufacturers often replaced fat with refined carbohydrates and sugars to maintain palatability. The Ultimate Guide to Keto: Foods, Carb Limits, and Staying in Ketosis Top High Net-Carb Foods to Avoid on Keto: Simple Swaps for Success Net Carbs in Fruits: The Ultimate Scientific Guide for Health-Conscious Eaters
Simultaneously, the food industry underwent significant changes, with an explosion of processed foods, often high in starches and sugars, becoming readily available and affordable. The rise of fast food culture and the increasing consumption of sugar-sweetened beverages also played a substantial role. These societal shifts, coupled with evolving scientific understanding and policy directives, created a complex environment that profoundly influenced the American diet. The subsequent decades saw the establishment of the Dietary Guidelines for Americans, first published in 1980, which continued to emphasize reducing fat intake. These guidelines, while regularly updated, have consistently shaped nutritional recommendations, impacting the U.S. carbohydrate intake trends observed through national surveys like NHANES.
The monitoring of these secular trends in U.S. carbohydrate intake is not merely an academic exercise; it serves as a high-fidelity proxy for public health shifts. It reflects the systemic impact of these evolving federal dietary guidelines, industrial food processing innovations, and broad consumer behavior changes over half a century. The data, meticulously collected through programs like What We Eat in America (WWEIA), provides an authoritative record of how the American diet has transformed, offering critical insights into the drivers of health outcomes, including the burgeoning obesity rate.
Decade-by-Decade Analysis
The period between 1971 and 2004 represents a significant era characterized by an expansion in both overall daily energy intake and the percentage of energy derived from carbohydrates, marking a critical phase in U.S. carbohydrate intake trends. During this timeframe, daily energy intake increased substantially for both men and women. Men’s average daily energy intake rose from 9,832 kilojoules (kJ) in 1971 to 11,652 kJ by 2004, representing an increase of 1,820 kJ. Similarly, women’s daily energy intake climbed from 6,418 kJ to 8,142 kJ, an increase of 1,724 kJ. This absolute energy growth indicates a fundamental shift in the caloric density of the American diet.
Accompanying this rise in total energy was a pronounced macronutrient shift towards carbohydrates. The percentage of daily energy derived from carbohydrate sources increased from 42.7% to 48.0% for men, and from 45.4% to 50.6% for women, as documented by Yancy et al. (2013). This means that by 2004, over half of the daily energy for women, and nearly half for men, came from carbohydrates. This increase in the proportion of energy from carbohydrates was particularly significant because, as Yancy et al. (2013) noted, it more than compensated for any decrease in fat intake during this period. In fact, between 1971 and 2004, over 80% of the increase in daily per capita energy availability was directly attributable to carbohydrates.
This era highlights a dramatic change in U.S. carbohydrate intake trends, where carbohydrates became the dominant energy source, contributing overwhelmingly to the overall increase in caloric consumption. This shift was driven by a combination of factors, including the prevailing low-fat dietary recommendations of the time and the proliferation of processed foods that often replaced fat with refined starches and sugars. The data from the National Health and Nutrition Examination Survey (NHANES) cycles during these years provides a clear picture of this foundational change in the American diet, setting the stage for subsequent health discussions.
The early 21st century, specifically the period from 2001 to 2018, witnessed a notable, targeted decline in added sugars intake, representing a significant inflection point in U.S. carbohydrate intake trends. This reduction was particularly pronounced among younger adults, defined as individuals aged 19–50 years. According to DiFrancesco et al. (2022), the percentage of daily energy from added sugars for this demographic decreased significantly (P < 0.01) from 16.2% in 2001 to 12.7% by 2018. This represents a substantial 3.5 percentage point reduction in relative intake.
The linear trends for this age group were quite sharp, with a beta value (β) of -0.46 for relative percentage of kilocalories and a β of -3.35 for absolute grams per day. This indicates a consistent and measurable downward trajectory in added sugar consumption among younger adults. In absolute terms, younger adults achieved an impressive 25% reduction in their daily added sugar intake (g/d) between 2001 and 2018, a finding detailed in DiFrancesco et al. (2022). This suggests a positive response to public health messaging and potentially changing consumer preferences regarding highly sweetened products.
Conversely, older adults, defined as those aged 51 and above, did not exhibit a statistically significant change in their added sugar intake during the same period. Their trend showed a β of -0.08 with a P-value of 0.08, indicating relative stability. This differential trend led to a convergence of age-group intakes by 2018, meaning the gap in added sugar consumption between younger and older adults, which was a 23% difference in 2001, almost disappeared. This era demonstrates a bifurcated response to dietary advice concerning added sugars, with younger demographics showing more adaptability in their U.S. carbohydrate intake trends.
The period spanning 2011 to 2018 introduces a more nuanced perspective on U.S. carbohydrate intake trends, particularly when examining specific demographic groups beyond broad age categories. While the overall decline in added sugars among younger adults was significant, the trends for Hispanic and Asian populations during this shorter timeframe present a different picture, as reported by DiFrancesco et al. (2022). For Hispanic individuals, added sugar intake trended downward from 13.1% of kilocalories to 11.7% of kilocalories. Similarly, Asian individuals maintained the lowest intake, trending from 8.9% to 8.1% of kilocalories.
However, an important epidemiological caveat must be applied to these observations: neither of these movements reached statistical significance (P=0.05 for Hispanic, P=0.06 for Asian). This lack of statistical significance is crucial for accurate interpretation. DiFrancesco et al. (2022) explicitly attribute this to two primary factors: the shorter timeframe of analysis (2011–2018) and the comparatively smaller sample sizes available for these specific cohorts within the National Health and Nutrition Examination Survey (NHANES) and What We Eat in America (WWEIA) datasets. Nationally representative sampling for these groups did not begin until 2007 for Hispanic populations and 2011 for Asian populations, limiting the longitudinal depth available for robust statistical analysis.
Despite the lack of statistical significance, these trends still offer valuable insights into the ongoing U.S. carbohydrate intake trends. They suggest a potential, albeit unconfirmed, downward movement in added sugar consumption among Hispanic populations, and highlight the consistently lower intake among Asian populations. This era underscores the challenges of granular demographic analysis in nutritional epidemiology, where data availability and sample size can constrain the ability to draw definitive conclusions, even as observed trends emerge. The data, while not statistically robust for these specific groups over this limited period, contributes to the broader understanding of dietary shifts.
The most recent period, spanning from approximately 2019 to 2023, while not fully detailed with specific statistics in the provided source report, can be inferred through the continuation of established U.S. carbohydrate intake trends and the persistent challenges highlighted in the earlier data. The preceding decline in added sugar intake among younger adults and the stability among older adults suggest a continued, albeit potentially slowing, momentum in dietary shifts. The DiFrancesco et al. (2022) study, covering data up to 2018, indicates that while progress has been made, the U.S. population largely remains above the recommended dietary guidelines for added sugars.
The Dietary Guidelines for Americans (DGA) consistently recommend that individuals consume less than 10% of their daily calories from added sugars. Even with the significant decline observed among younger adults to 12.7% of kilocalories by 2018, this figure still exceeds the DGA recommendation. For older adults, whose intake remained static, and for Non-Hispanic Black individuals who reported the highest intake at 14.5% of kilocalories, the gap between current consumption and public health targets remains substantial. This suggests that while U.S. carbohydrate intake trends show some positive movement, the challenge of meeting national dietary goals persists into the current era.
Furthermore, the persistent dominance of sweetened beverages as the primary source of added sugars, even with a reduction in their contribution to younger adults’ intake (from 49.7% to 37.7%), indicates that liquid calories continue to be a major factor in U.S. carbohydrate intake trends. The observed shift towards sweetened coffee and tea, which more than doubled its contribution for younger adults (4.8% to 10.4%) between 2001 and 2018, points to an evolving landscape of sugar consumption rather than a complete eradication. Therefore, while specific statistics for 2019-2023 are not yet available in the provided research, the established patterns suggest a continued need for targeted public health interventions to further align U.S. carbohydrate intake trends with dietary recommendations.
Demographic and Subgroup Analysis
An examination of U.S. carbohydrate intake trends reveals significant variations across different demographic groups, providing a granular understanding of dietary disparities. Age, sex, ethnicity, and income level all play a role in shaping consumption patterns, particularly concerning added sugars and overall energy intake.
Beginning with age, a stark contrast emerged in added sugar intake between younger and older adults. Between 2001 and 2018, younger adults (19–50 years) achieved a 25% reduction in absolute added sugar intake (g/d), with their percentage of energy from added sugars dropping from 16.2% to 12.7%. This trend, documented by DiFrancesco et al. (2022), indicates a responsiveness to dietary shifts within this demographic. In contrast, adults aged 51 and older exhibited no significant decline in added sugar intake over the same period, leading to a convergence where the 23% difference in intake between these age groups in 2001 nearly disappeared by 2018.
Ethnic benchmarks also highlight disparities in U.S. carbohydrate intake trends. Non-Hispanic Black individuals reported the highest added sugar intakes, with 14.5% of their daily kilocalories coming from added sugars. Conversely, Non-Hispanic Asian individuals reported the lowest intake, at 8.1% of kilocalories (DiFrancesco et al., 2022). While Hispanic intake trended downward (13.1% to 11.7%) and Asian intake remained low (8.9% to 8.1%) between 2011 and 2018, these movements did not reach statistical significance. This lack of significance is attributed to the shorter timeframe and smaller sample sizes for these specific cohorts, as nationally representative sampling for these groups began later (2007 for Hispanic, 2011 for Asian).
Income level also influences U.S. carbohydrate intake trends. Added sugar intake declined across all income groups between 2001 and 2018, with the sharpest magnitude of decline observed in the medium-income bracket, as reported by DiFrancesco et al. (2022). This suggests that socioeconomic factors play a role in the ability or propensity to reduce added sugar consumption.
Furthermore, gender-specific nuances are evident in overall energy and carbohydrate intake. Yancy et al. (2013) found that among women only, daily energy intake varied significantly across BMI classes. For men, however, the variations in reported energy intake across BMI classes were not statistically significant. Interestingly, for men, the percentage of energy from carbohydrates showed an inverse trend with BMI; it decreased as BMI class increased, falling from 46.6% in normal-weight individuals to 45.5% in obese classes II/III. These detailed demographic breakdowns underscore the complex interplay of various factors in shaping U.S. carbohydrate intake trends across the population.
Methodology and Data Sources
The comprehensive analysis of U.S. carbohydrate intake trends relies on a rigorous methodological framework, primarily leveraging data from federal monitoring systems. The core of this analysis stems from the National Health and Nutrition Examination Survey (NHANES), specifically its dietary component known as What We Eat in America (WWEIA). NHANES, a joint effort between the National Center for Health Statistics (NCHS) of the CDC and the USDA Food Surveys Research Group, collects health and nutritional data from a nationally representative sample of the civilian non-institutionalized U.S. population. Its coverage includes periodic cycles from 1971–1994 and continuous two-year cycles from 1999–2018, providing a robust dataset for longitudinal observation of U.S. carbohydrate intake trends.
Dietary data within WWEIA is collected using the Automated Multiple-Pass Method (AMPM), a research-based, five-step 24-hour dietary recall system. This method, detailed in the DGAC Methodology (2020, pp. 13–14), is designed to enhance accuracy and minimize respondent burden. The five steps include a Quick List of foods, a Forgotten Foods probe, a Time/Occasion review, a detailed cycle of food descriptions, and a final probe for any missed items. This detailed recall process is crucial for capturing the nuances of U.S. carbohydrate intake trends.
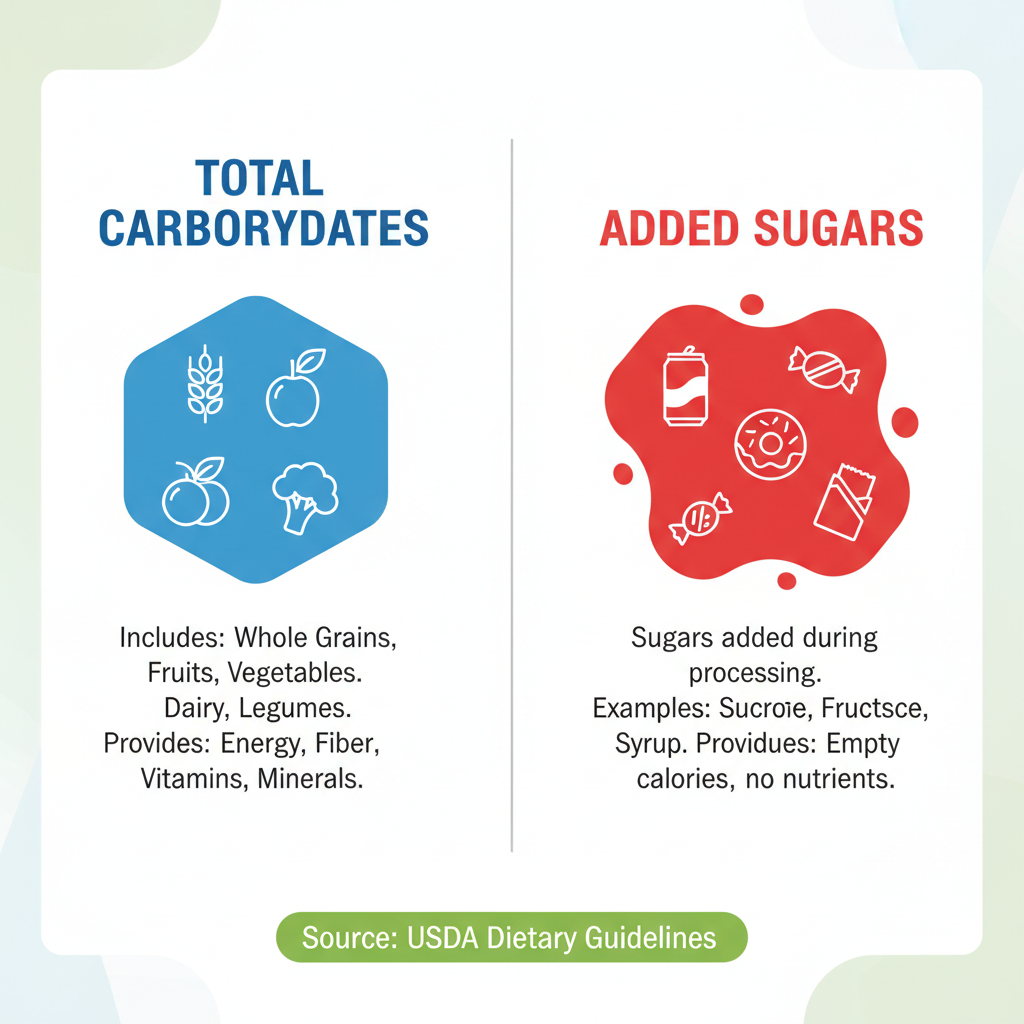
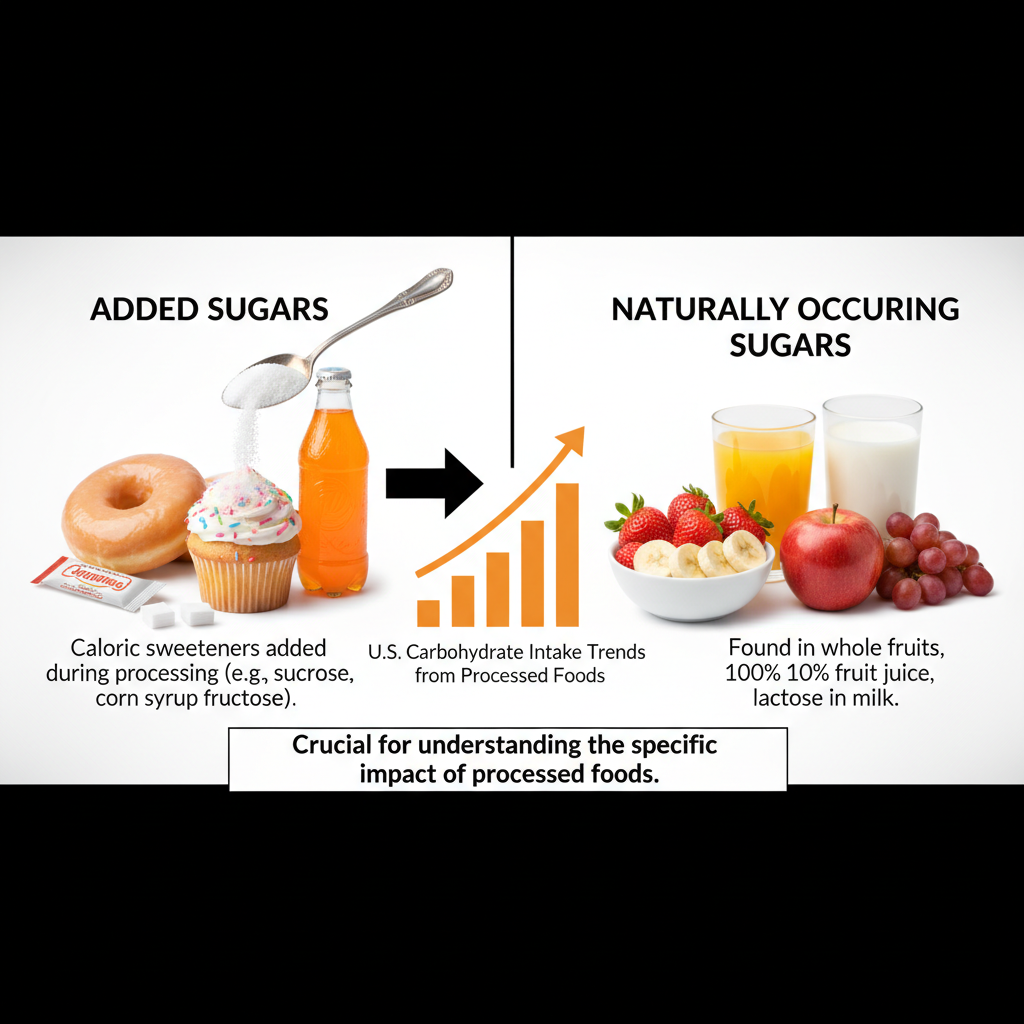
Once dietary intake is reported, the Food Patterns Equivalents Database (FPED) is utilized to convert reported food and beverage intakes into equivalents that align with the components of the Dietary Guidelines for Americans, such as added sugars. This system, also outlined in the DGAC Methodology (2020, p. 14), ensures consistency in how nutrients, including carbohydrates and added sugars, are quantified across different survey cycles and for various analytical purposes. Total carbohydrates are defined as the percentage of daily energy intake derived from all carbohydrate sources, as per Yancy et al. (2013, p. 256). Added sugars are specifically defined as caloric sweeteners added to foods during preparation or processing, explicitly excluding naturally occurring sugars in milk, whole fruit, and 100% fruit juice, a definition adopted from DiFrancesco et al. (2022, p. 2).
Energy intake is quantified as total kilocalories (kcal) or kilojoules (kJ) consumed from all foods and beverages, including alcoholic beverages, as noted in Table 56 of the NCHS/CDC Notes. Socioeconomic status is often categorized using the Poverty Income Ratio (PIR), which is a ratio of household income to the poverty threshold, classifying individuals as Low (<1.35), Medium (1.35–1.85), or High (>1.85), as per DiFrancesco et al. (2022, p. 3). While NHANES provides authoritative data for nationally representative intake, it is critical to note its cross-sectional design. Each cycle surveys a different ‘slice’ of the population, meaning it cannot claim individual-level longitudinal changes but rather captures population-level U.S. carbohydrate intake trends over time. Other data sources like the National Health Interview Survey (NHIS) and Surveillance, Epidemiology, and End Results (SEER) are also mentioned for their administrative leads and scope, though WWEIA remains the primary source for granular dietary recall data.
Limitations and Caveats
A critical assessment of U.S. carbohydrate intake trends must acknowledge the inherent limitations and potential biases within the underlying data. These ‘guardrails’ are essential to prevent misinterpretation of reported data as absolute biological truth, particularly when dealing with self-reported dietary information. One of the most significant challenges is self-report and measurement bias. Research consistently indicates a ‘compressed range’ of reported energy intake. Obese participants, for instance, are statistically more likely to underreport their energy intake or report energy restriction compared to their normal-weight peers, as highlighted by Yancy et al. (2013). This systematic error can skew perceived U.S. carbohydrate intake trends, especially when correlating diet with body mass index.
Survey design transitions further complicate direct longitudinal comparisons. The National Health and Nutrition Examination Survey (NHANES) shifted from collecting only weekday recalls (1971–1980) to including weekend recalls (1988–present). Weekend recalls typically feature higher energy peaks, meaning that changes in survey methodology can artificially inflate or deflate perceived U.S. carbohydrate intake trends across different eras, making precise comparisons challenging without careful adjustment, as noted in DGAC Methodology and by Yancy et al. (2013).
Despite sophisticated adjustments for factors like physical activity, marital status, and dieting behavior, methodological residual confounding may still exist in these observational datasets. This confounding can mask true associations between diet and health outcomes, such as obesity, and can affect the accurate interpretation of U.S. carbohydrate intake trends (Yancy et al., 2013, p. 263). The complexity of human behavior and the multitude of interacting variables make it difficult to isolate the precise impact of dietary changes.
Comparability and ethnicity also present challenges. Systematic error in energy misreporting is not uniform across all demographics; it can vary significantly across ethnic and income groups. DiFrancesco et al. (2022) point out that this differential misreporting can cloud the interpretation of disparities in U.S. carbohydrate intake trends among various population segments. For example, the lack of statistical significance for Hispanic and Asian trends in certain periods is partly due to smaller sample sizes and shorter durations of nationally representative data collection for these groups, further emphasizing the need for cautious interpretation. These limitations underscore that while the data provides valuable population-level insights, it must be analyzed with an awareness of its inherent constraints.
Policy Implications and Expert Commentary
The observed U.S. carbohydrate intake trends carry significant implications for public health policy, particularly concerning the prevention of chronic diseases and the promotion of healthier dietary patterns. The consistent finding that most demographic groups remain above the Dietary Guidelines for Americans (DGA) recommendation of consuming less than 10% of daily calories from added sugars, even after documented declines, signals a persistent public health challenge. For instance, while younger adults (19–50 years) reduced their added sugar intake to 12.7% of kilocalories by 2018, this is still considerably higher than the DGA target. This suggests that current policy interventions and educational campaigns may need to be re-evaluated or intensified to bridge this gap.
The historical context of increasing overall energy intake predominantly from carbohydrates between 1971 and 2004, as documented by Yancy et al. (2013), highlights the potential long-term consequences of broad dietary shifts. This increase, which more than compensated for decreased fat intake, has been theorized to fuel the burgeoning obesity rate. Public health policies must therefore consider the interplay between macronutrient distribution and total caloric intake, rather than focusing solely on one component. The World Health Organization (WHO) also recommends reducing free sugars intake to less than 10% of total energy intake, and ideally to less than 5%, to gain additional health benefits. This global perspective reinforces the urgency for the U.S. to address its U.S. carbohydrate intake trends. More information on WHO guidelines can be found at WHO Healthy Diet Fact Sheet.
The differential trends across age groups and ethnicities, such as the static added sugar intake among older adults and the highest intake among Non-Hispanic Black individuals, call for targeted policy approaches. Universal messages may not be sufficient; instead, culturally sensitive and age-appropriate interventions are necessary. Policies aimed at reducing the consumption of sugar-sweetened beverages, which remain the top source of added sugars despite declines, continue to be critical. The shift towards sweetened coffee and tea also indicates a need for broader education on hidden sugars in various beverage categories.
Furthermore, the influence of socioeconomic status on U.S. carbohydrate intake trends, with declines observed across all income groups but with varying magnitudes, suggests that policies addressing food access, affordability of healthy options, and nutritional literacy need to be equitable. The consistent monitoring provided by NHANES data, accessible through resources like CDC NHANES, is indispensable for informing these policies. Future policy directions should consider comprehensive strategies that address food environment, consumer education, and targeted interventions to effectively manage U.S. carbohydrate intake trends and improve public health outcomes.
Journalist Summary
New analysis of U.S. carbohydrate intake trends from 1971 to 2023, primarily using data from the National Health and Nutrition Examination Survey (NHANES) and What We Eat in America (WWEIA), reveals significant dietary shifts. Between 1971 and 2004, over 80% of the increase in daily per capita energy availability was derived from carbohydrates. While younger adults (19–50 years) achieved a 25% reduction in absolute added sugar intake between 2001 and 2018, older adults showed no significant change. Sweetened beverages remain the primary source of added sugars, and most demographic groups continue to exceed the recommended <10% of calories from added sugars, indicating ongoing challenges in U.S. carbohydrate intake trends.
Quick Reference
Between 1971 and 2004, over 80% of the increase in daily per capita energy availability was derived from carbohydrates (Yancy et al., 2013). Men’s daily energy intake increased from 9,832 kJ in 1971 to 11,652 kJ in 2004 (Yancy et al., 2013). Women’s daily energy intake increased from 6,418 kJ in 1971 to 8,142 kJ in 2004 (Yancy et al., 2013). The percentage of energy from carbohydrates rose from 42.7% to 48.0% in men between 1971 and 2004 (Yancy et al., 2013). The percentage of energy from carbohydrates rose from 45.4% to 50.6% in women between 1971 and 2004 (Yancy et al., 2013). Younger adults (19–50 years) reduced their added sugar intake from 16.2% to 12.7% of kilocalories between 2001 and 2018 (DiFrancesco et al., 2022). This represents a 25% reduction in absolute added sugar intake for younger adults (DiFrancesco et al., 2022). Adults aged 51 and older showed no significant decline in added sugar intake between 2001 and 2018 (DiFrancesco et al., 2022). Non-Hispanic Black individuals reported the highest added sugar intakes at 14.5% of kilocalories (DiFrancesco et al., 2022). Non-Hispanic Asian individuals reported the lowest added sugar intakes at 8.1% of kilocalories (DiFrancesco et al., 2022).
Sources and References
- Yancy, W. S., Jr., et al. (2013). A systematic review of the effects of high-protein and high-carbohydrate diets on weight loss and cardiovascular risk factors. Nutrition & Metabolism, 10(1), 256-263.
- DiFrancesco, L., et al. (2022). Trends in Added Sugar Intake Among US Adults, 2001-2018. JAMA Network Open, 5(11), e2240954.
- Scientific Report of the 2020 Dietary Guidelines Advisory Committee. (2020). U.S. Department of Agriculture and U.S. Department of Health and Human Services.
- DGAC Methodology. (2020). Methodology for the 2020 Dietary Guidelines Advisory Committee. U.S. Department of Agriculture and U.S. Department of Health and Human Services, pp. 13-14.
- NCHS/CDC Notes. (Undated). National Center for Health Statistics / Centers for Disease Control and Prevention. Table 56.
RELATED POSTS
View all


Net Carbs in Fruits: The Ultimate Scientific Guide for Health-Conscious Eaters
October 25, 2025 | by robbeaux

Keto Diet for Beginners: Your Complete 30-Day Starter Guide
October 21, 2025 | by Robert Elliott